In-house corporate planners will be a busy bunch: In this survey, nearly 30 percent say they will stage more events this year than in 2006, and a whopping 42 percent predict that 2008 will be even busier than 2007. And independents have been busy responding to RFPs — 37 percent of respondents this year say they contract with independent planners, up from 27 percent last year.
STAGING EVENTS
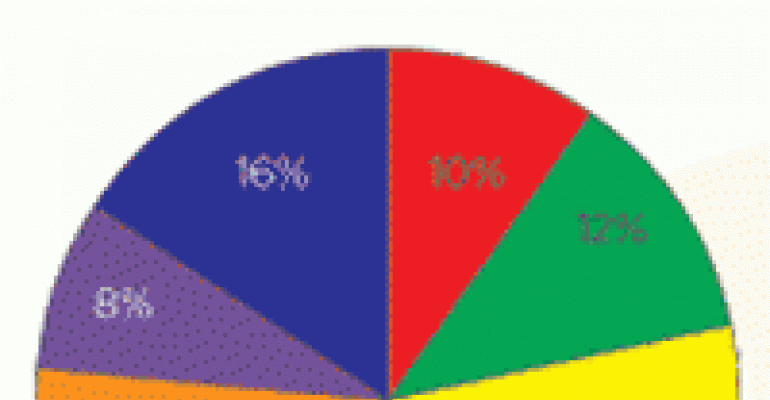
Approximately how many corporate special events (including incentive trips, gala product launches, marketing events, recognition dinners, company picnics, etc.) will your company stage in 2007? Percentage of respondents
Will the number of corporate events that you stage this year be more or less than your “typical” amount? (Data below compares responses from last year with this year.) Percentage of respondents
We will stage more events this year | 2003 | 17% |
| 2004 | 25% |
| 2005 | 27% |
| 2006 | 26% |
| 2007 | 29% |
We will stage about the same amount | 2003 | 67% |
| 2004 | 68% |
| 2005 | 68% |
| 2006 | 67% |
| 2007 | 63% |
We will stage fewer events this year | 2003 | 16% |
| 2004 | 7% |
| 2005 | 5% |
| 2006 | 7% |
| 2007 | 8% |
How will the number of events you stage next year compare with this year? Percentage of respondents
We will hold more next year | 2003 | 24% |
| 2004 | 28% |
| 2005 | 27% |
| 2006 | 39% |
| 2007 | 42% |
We will hold approximately the same | 2003 | 68% |
| 2004 | 68% |
| 2005 | 68% |
| 2006 | 58% |
| 2007 | 54% |
We will hold fewer events next year | 2003 | 8% |
| 2004 | 4% |
| 2005 | 5% |
| 2006 | 4% |
| 2007 | 4% |
BUDGETING
How do you expect your company's budget allocation for staging corporate special events to change next year compared to this year? Percentage of respondents
Increase by more than 10% | 2003 | 6% |
| 2004 | 7% |
| 2005 | 7% |
| 2006 | 6% |
| 2007 | 9% |
Increase by 6% to 10% | 2003 | 5% |
| 2004 | 11% |
| 2005 | 6% |
| 2006 | 11% |
| 2007 | 15% |
Increase by 1% to 5% | 2003 | 20% |
| 2004 | 25% |
| 2005 | 23% |
| 2006 | 25% |
| 2007 | 30% |
Stay the same | 2003 | 45% |
| 2004 | 39% |
| 2005 | 40% |
| 2006 | 36% |
| 2007 | 31% |
Decrease by 1% to 5% | 2003 | 10% |
| 2004 | 6% |
| 2005 | 6% |
| 2006 | 4% |
| 2007 | 3% |
Decrease by 6% to 10% | 2003 | 3% |
| 2004 | 2% |
| 2005 | 2% |
| 2006 | 3% |
| 2007 | 3% |
Decrease by more than 10% | 2003 | 2% |
| 2004 | 1% |
| 2005 | 3% |
| 2006 | 3% |
| 2007 | 1% |
Unsure/no answer | 2003 | 9% |
| 2004 | 11% |
| 2005 | 13% |
| 2006 | 14% |
| 2007 | 9% |
TAKE IT OUTSIDE?
Do you contract with independent event planners? Percentage of respondents
Yes | 2003 | 28% |
| 2004 | 27% |
| 2005 | 28% |
| 2006 | 27% |
| 2007 | 37% |
No, with no plans to contract with independent planners | 2003 | 59% |
| 2004 | 64% |
| 2005 | 61% |
| 2006 | 62% |
| 2007 | 53% |
Unsure/no answer | 2003 | 3% |
| 2004 | 7% |
| 2005 | 5% |
| 2006 | 5% |
| 2007 | 1% |
No, however, we are considering it | 2003 | 10% |
| 2004 | 9% |
| 2005 | 6% |
| 2006 | 7% |
| 2007 | 9% |
MEASURING THE PARTY'S PAYOFF
Do you attempt to measure the ROI (return on investment) of your special events? Percentage of respondents
Yes | 2003 | 32% |
| 2004 | 36% |
| 2005 | 44% |
| 2006 | 56% |
| 2007 | 51% |
No, however, we are considering it | 2003 | 22% |
| 2004 | 29% |
| 2005 | 23% |
| 2006 | 20% |
| 2007 | 21% |
No plans to measure ROI | 2003 | 32% |
| 2004 | 20% |
| 2005 | 24% |
| 2006 | 13% |
| 2007 | 20% |
Unsure/no answer | 2003 | 14% |
| 2004 | 15% |
| 2005 | 9% |
| 2006 | 11% |
| 2007 | 8% |
What methods do you use to measure the ROI (return on investment) of your special events? Multiple answers possible
| Response from attendees | 70% |
| New client leads | 63% |
| Client retention | 60% |
| Total attendance | 59% |
| Revenue | 58% |
| Sales | 48% |
| Response from management | 44% |
| Surveys | 43% |
| Other | 4% |


